Metabolic Testing: What the Tests Actually Measure — and What They Miss
A standard blood panel is a useful starting point. It is not a complete metabolic picture.
Written by Dr. Steven Gabriel, MD · Board-Certified Emergency Physician · June 2026
Key Takeaways
- Standard metabolic blood panels — the CMP and BMP — measure organ function and basic chemistry. They were not designed to detect early metabolic dysfunction.
- Fasting insulin, waist circumference, and the triglyceride-to-HDL ratio are the most sensitive early markers of insulin resistance — and none of them appear in a standard annual physical by default.
- A comprehensive metabolic evaluation requires looking beyond lab values to the signal domains that blood tests cannot capture: appetite, digestion, sleep quality, and stress hormone patterns.
- All laboratory results require interpretation by a qualified clinician. This article is educational context, not clinical guidance.
- The BeyondGLP Metabolic Assessment evaluates the five signal domains — Appetite & Hunger Signals, Energy & Blood Sugar Control, Digestion & Gut Health, Sleep & Recovery, and Hormones & Stress Response — alongside what standard testing provides.

From Dr. Gabriel
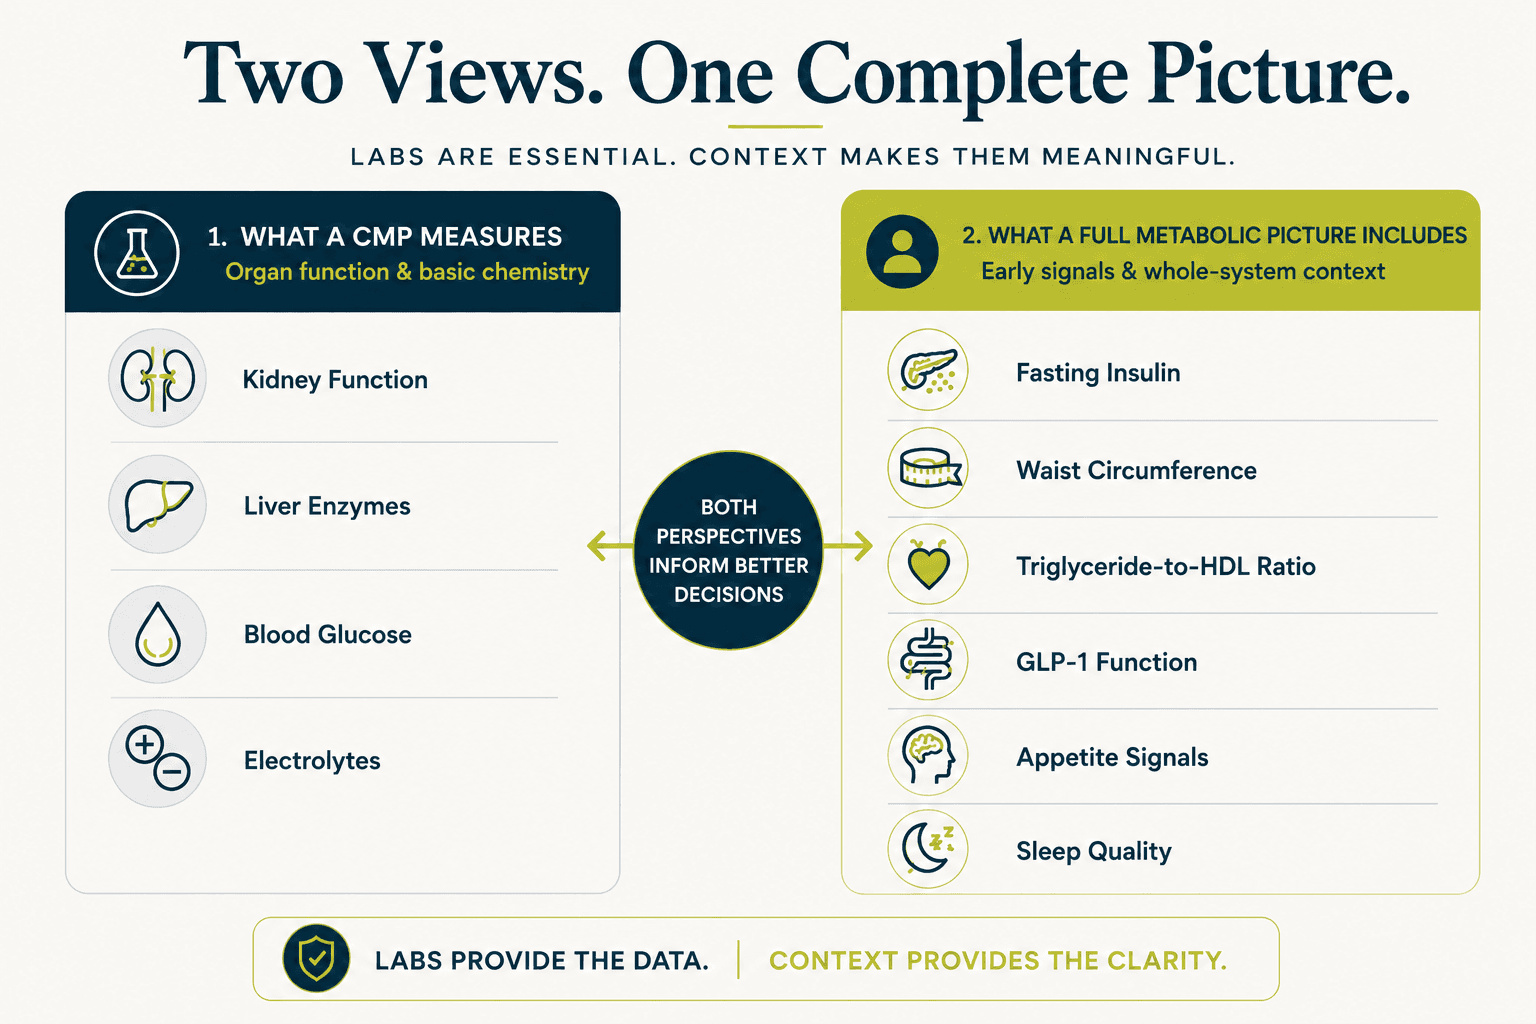
“I order metabolic panels every shift. I know exactly what they tell me — and exactly what they don’t. A comprehensive metabolic panel gives me a snapshot of kidney function, liver enzymes, blood glucose, and electrolytes. It is an excellent tool for detecting organ damage, acute illness, and gross metabolic derangement. What it does not tell me is whether insulin resistance has been building for five years, whether visceral fat is accumulating around the abdominal organs, or whether the patient’s GLP-1 function is impaired enough to explain why they’ve gained 20 pounds since their last visit. Those answers require different questions — and often different tests. The standard panel was designed for a different purpose. That doesn’t make it wrong. It makes it incomplete.”
When a doctor orders metabolic testing, the results typically come back as a series of numbers with reference ranges. Most of them are normal. Occasionally one is flagged. What rarely happens is a conversation about what the panel was designed to detect, what it cannot detect, and what the most sensitive early markers of metabolic dysfunction actually are. Metabolic health — the overall functional state of the body’s five signal domains — is not fully captured by any single blood panel. Understanding what each test measures, where the gaps are, and what a more complete metabolic picture looks like will help you use these tools correctly.
What a standard metabolic panel actually measures
According to MedlinePlus, part of the National Library of Medicine, a comprehensive metabolic panel (CMP) measures fourteen substances in the blood that reflect kidney function, liver function, blood sugar, blood protein levels, and electrolyte balance.
The fourteen components of a CMP are: glucose (blood sugar), calcium, albumin, total protein, sodium, potassium, bicarbonate, chloride, blood urea nitrogen (BUN), creatinine, alkaline phosphatase (ALP), alanine aminotransferase (ALT), aspartate aminotransferase (AST), and bilirubin. A basic metabolic panel (BMP) includes eight of these — primarily the kidney function and electrolyte markers — without the liver enzymes and protein values.
These panels are specifically designed to detect organ dysfunction, acute illness, electrolyte imbalances, and gross blood sugar abnormalities. They are valuable and appropriate for those purposes. They were not designed to detect the early stages of insulin resistance, visceral fat accumulation, impaired GLP-1 function, or any of the other markers that characterise the decade of metabolic dysfunction that typically precedes a clinical diagnosis [2].
What a lipid panel measures — and the number most people miss
A standard lipid panel measures total cholesterol, LDL cholesterol, HDL cholesterol, and triglycerides. These are useful values. But the individual numbers tell less of the story than their relationship to each other.
The triglyceride-to-HDL ratio — triglycerides divided by HDL — is one of the most accessible and informative indicators of insulin resistance in standard bloodwork. A meta-analysis of 22 prospective cohort studies found that adults with the highest fasting insulin levels had a 63% higher risk of hypertension and a 50% higher risk of coronary heart disease than those with the lowest levels (Xun P, Wu Y, He Q, He K, American Journal of Clinical Nutrition, 2013 — PMID 24132974) [1]. The triglyceride-to-HDL ratio is a proxy for fasting insulin — it rises in parallel with insulin resistance, typically years before fasting glucose crosses a clinical threshold.
A ratio above 2 is considered elevated. A ratio above 3 is associated with significant insulin resistance. Most people have never been told this number exists — because neither triglycerides nor HDL alone triggers clinical concern unless they are individually abnormal. The ratio is calculated in seconds from numbers already in the panel.
According to the National Institute of Diabetes and Digestive and Kidney Diseases, insulin resistance — the reduced ability of cells to respond to insulin — is the central mechanism of metabolic dysfunction [3]. Standard lipid panels capture the downstream effects of insulin resistance. Fasting insulin captures the cause.
The most important test that is rarely ordered: fasting insulin
Fasting insulin is the single most sensitive early marker of insulin resistance — and it is almost never included in a standard annual panel.
Fasting glucose measures how much sugar is in the blood after an overnight fast. Fasting insulin measures how much insulin the pancreas is producing to maintain that glucose level. In early insulin resistance, glucose remains normal while insulin rises — because the pancreas is compensating for declining cellular insulin sensitivity by producing more of it. The glucose looks fine. The insulin tells a different story.
The gap between elevated fasting insulin and elevated fasting glucose is precisely the window where metabolic dysfunction is most addressable. Identifying it requires ordering fasting insulin — a test that is not standard, not expensive, and not routinely discussed. If you want to understand your early metabolic picture, asking your clinician for fasting insulin alongside fasting glucose is the single most useful addition to a standard panel.
Clinical interpretation of fasting insulin values requires a qualified clinician. This article provides educational context only.
Waist circumference — the measurement that predicts more than BMI
Waist circumference is not a blood test. It is a tape measure and 30 seconds. It is also the most directly measurable indicator of visceral fat accumulation — and it is one of the five criteria for metabolic syndrome as defined by the American Heart Association [4].
Waist circumference above 102cm in men or 88cm in women is associated with significantly elevated metabolic risk. These are not weight thresholds. They are fat distribution thresholds — specifically, a proxy for visceral fat accumulation around the abdominal organs, which drives metabolic dysfunction independently of total body weight and BMI.
Waist circumference is not routinely measured at most annual physicals. It does not appear in any blood panel. But for assessing visceral fat accumulation — which is more metabolically consequential than subcutaneous fat — it is more informative than either weight or BMI alone.
What standard testing cannot capture
Standard metabolic testing provides a valuable but partial picture. The dimensions of metabolic function that blood panels cannot capture include:
Postprandial blood sugar response
Fasting glucose reflects one moment in the glycaemic cycle. How blood sugar rises and falls after meals — the pattern of spikes and clearance rates across the day — is not captured by any standard panel. Continuous glucose monitoring (CGM) provides this picture; fasting glucose does not.
GLP-1 function
The gut's capacity to produce GLP-1 in response to food — which governs satiety, insulin stimulation, and appetite regulation — is not measured by any standard blood test. GLP-1 dysfunction is a primary driver of food noise, persistent hunger after meals, and impaired blood sugar regulation, but it is invisible in standard panels.
Appetite and hunger signal reliability
Whether hunger signals arrive at appropriate times, produce reliable satiety, and respond proportionately to food intake is entirely a subjective, experiential assessment. No blood test captures it.
Sleep quality and its metabolic effects
Sleep architecture, depth of recovery sleep, and the degree to which sleep is restoring hormonal function overnight cannot be assessed from bloodwork. Their metabolic effects — GLP-1 suppression, ghrelin elevation, next-day insulin resistance — also cannot be captured from a single fasting sample.
Cortisol patterns and stress hormone impact
A single cortisol blood draw captures one moment in a diurnal rhythm that varies significantly across the day. Chronic cortisol elevation — the pattern that impairs insulin sensitivity, drives visceral fat deposition, and blunts GLP-1 output — requires either salivary cortisol testing across the day or clinical inference from symptoms.
A more complete metabolic picture
A comprehensive metabolic evaluation — one that reflects the full state of the five signal domains — would include:
From standard bloodwork
Fasting glucose, fasting insulin, full lipid panel (including triglyceride-to-HDL ratio calculation), blood pressure, and relevant organ function markers.
From clinical measurement
Waist circumference — the most directly measurable indicator of visceral fat accumulation, and one of the five AHA criteria for metabolic syndrome.
From self-reported assessment
Appetite and hunger signal reliability, energy pattern and blood sugar stability, digestion quality, sleep restoration, and stress hormone patterns. This dimension is what the BeyondGLP Metabolic Assessment is designed to evaluate. It does not replace laboratory testing or clinical interpretation.
Free · Physician-reviewed · Results in under 5 minutes
Common Questions
What is the difference between a CMP and a BMP?
A comprehensive metabolic panel (CMP) includes 14 measurements covering kidney function, liver enzymes, blood sugar, proteins, and electrolytes. A basic metabolic panel (BMP) includes 8 measurements — the kidney function and electrolyte markers only, without the liver enzymes and protein values. According to MedlinePlus, part of the National Library of Medicine, both panels are used to assess organ function and general health, not specifically to evaluate metabolic dysfunction.
Should I ask my doctor for a fasting insulin test?
If you are interested in understanding your early metabolic picture — particularly if you have symptoms like afternoon energy crashes, persistent cravings, or changing body composition — asking your clinician about fasting insulin is a reasonable conversation. How to interpret the result, what constitutes an elevated value for your specific situation, and whether additional testing is warranted are clinical questions that require a qualified clinician's judgement.
What is a good triglyceride-to-HDL ratio?
A ratio below 2 is generally considered in range; above 3 is associated with significant insulin resistance in prospective cohort research. This is educational context — your clinician can interpret your specific values in the context of your full metabolic picture and individual circumstances.
Is a fasting glucose of 95 mg/dL a concern?
A value of 95 mg/dL is within the standard normal range (typically 70–99 mg/dL). It is also in the upper portion of that range. Research suggests that insulin resistance is well underway by the time fasting glucose reaches the high-normal range — but what this means for any individual person requires clinical interpretation of their full panel, history, and symptoms. This article provides educational context only.
Can the BeyondGLP Metabolic Assessment replace a blood test?
No. The assessment evaluates the signal domains that blood tests cannot capture — appetite, energy patterns, digestion, sleep, and stress hormones. It does not measure glucose, insulin, lipids, or any blood chemistry. It is designed to complement laboratory testing by providing the non-lab dimension of the metabolic picture. Clinical decisions require a qualified clinician.
Scientific References
- 1.Xun P, Wu Y, He Q, He K. Fasting insulin concentrations and incidence of hypertension, stroke, and coronary heart disease: a meta-analysis of prospective cohort studies. American Journal of Clinical Nutrition, 2013. PMID 24132974.
- 2.MedlinePlus, National Library of Medicine, National Institutes of Health. Comprehensive Metabolic Panel (CMP).
- 3.National Institute of Diabetes and Digestive and Kidney Diseases (NIDDK), National Institutes of Health. Insulin Resistance and Prediabetes.
- 4.American Heart Association. About Metabolic Syndrome.
See which of your five signal domains may need attention
Educational only. This page is for general education and is not medical advice, diagnosis, or treatment. All laboratory test results require interpretation by a qualified clinician. Always consult a qualified healthcare provider regarding medical decisions and laboratory testing. No outcomes are promised — individual results vary. The BeyondGLP Metabolic Assessment is an educational metabolic profile, not a diagnostic device. Reviewed by Dr. Steven Gabriel MD on June 2026.
Physician-built · Free · 3 min